Profile your Ember app with ember-renderspeed
27 November 2013
If your application has lots of things going on or you render a large list, you might see your once snappy app lose some of that swiftness. Naturally, you want to speed your application up and the first thing to do in these cases is to know where the bottlenecks are.
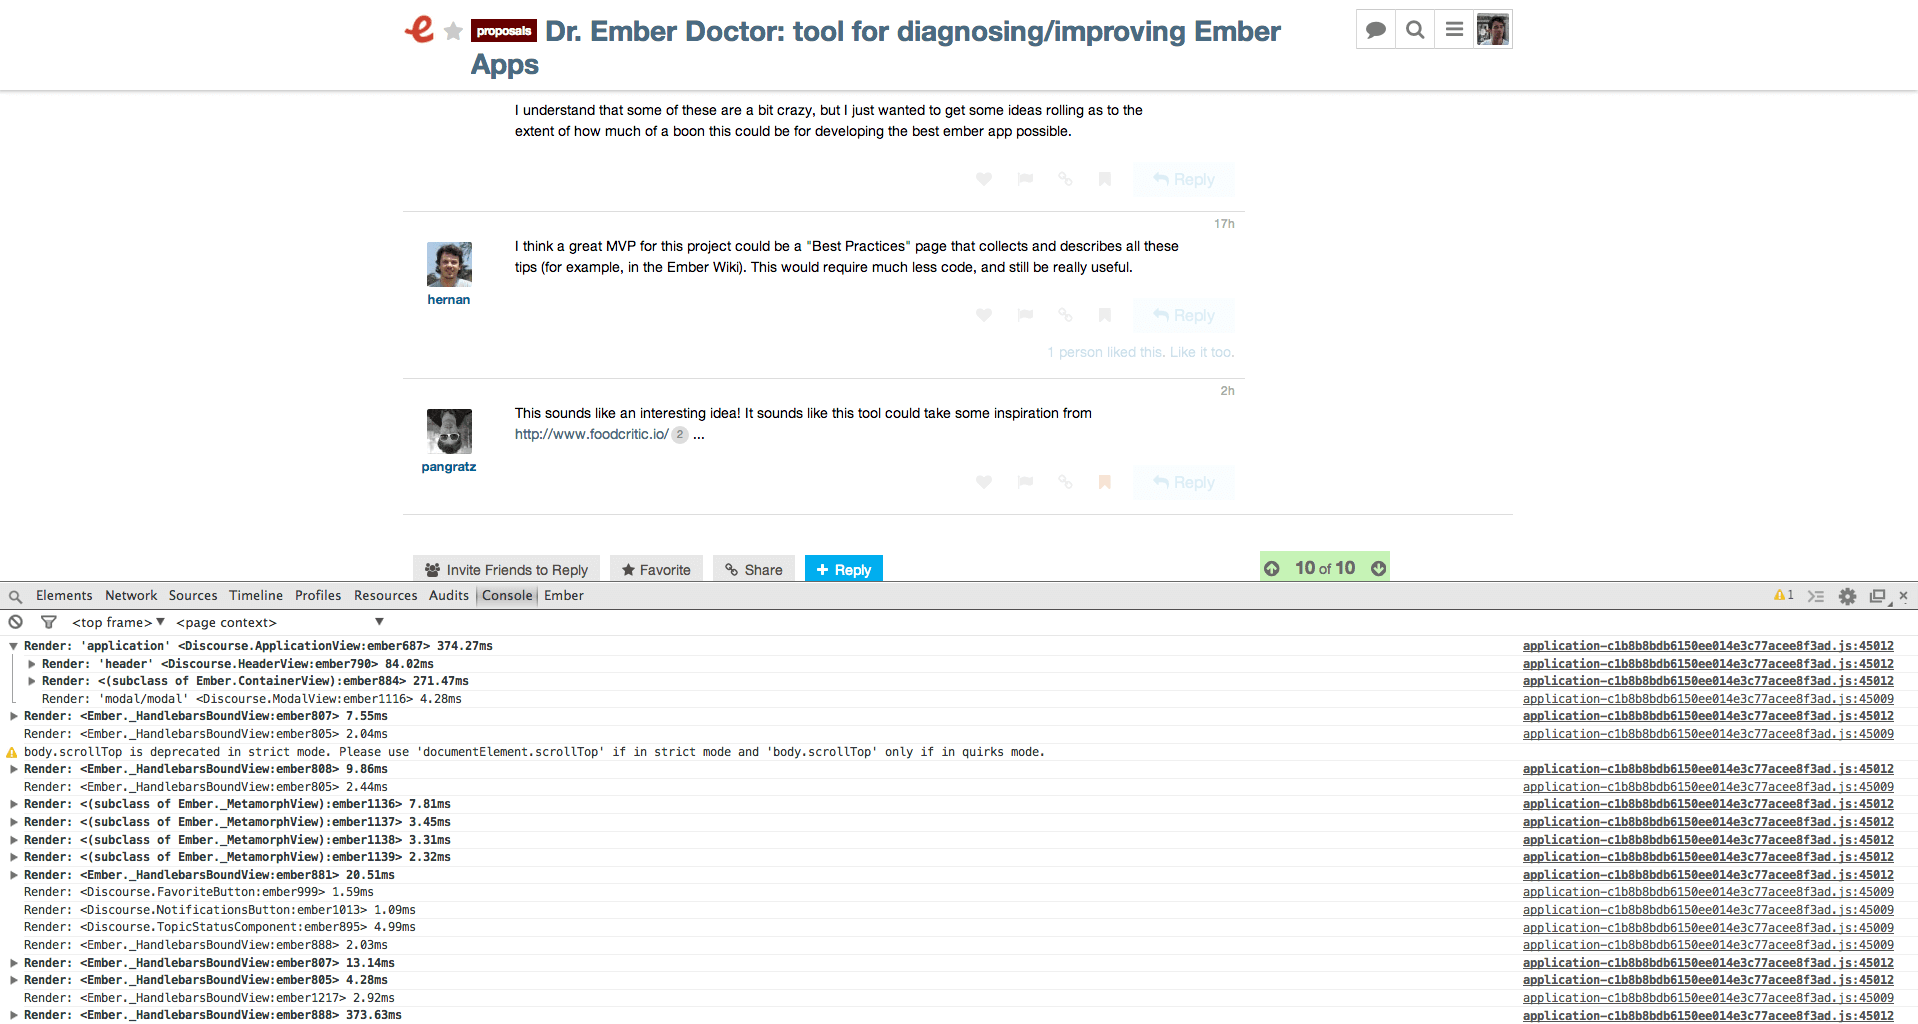
One solution to this is to integrate ember-renderspeed, a very simple library released by the Discourse team. It shows the rendering time of your templates and views on your development console, in a nicely nested form. Don't get frightened by the verb "integrate". It is as easy as downloading the js file and adding a script tag to it.
Once you did that, open your Javascript console in your browser, reload the page and observe the profile of your application. It is enabled by default on the Ember discussion forum, so you can take a look there. You will see something like the following:

Under the hood, ember-renderspeed uses Ember's instrumentation facilities, so should ember-renderspeed not work for your problem, you can always roll your own or use a third-party service, like Caliper.
That said, ember-renderspeed is a very quick and easy way to profile your app and can be the first tool you reach for when the need arises.
Share on Twitter